FibaCloud
Skip to content
Ask a question

Press ESC to close

Install Grafana OSS on Ubuntu 24.04

This guide installs Grafana OSS on Ubuntu 24.04 LTS and verifies a first dashboard. Grafana does not necessarily collect your metrics: it queries and visualizes sources such as Prometheus or InfluxDB. Verify the package series, repository and data-source compatibility together.

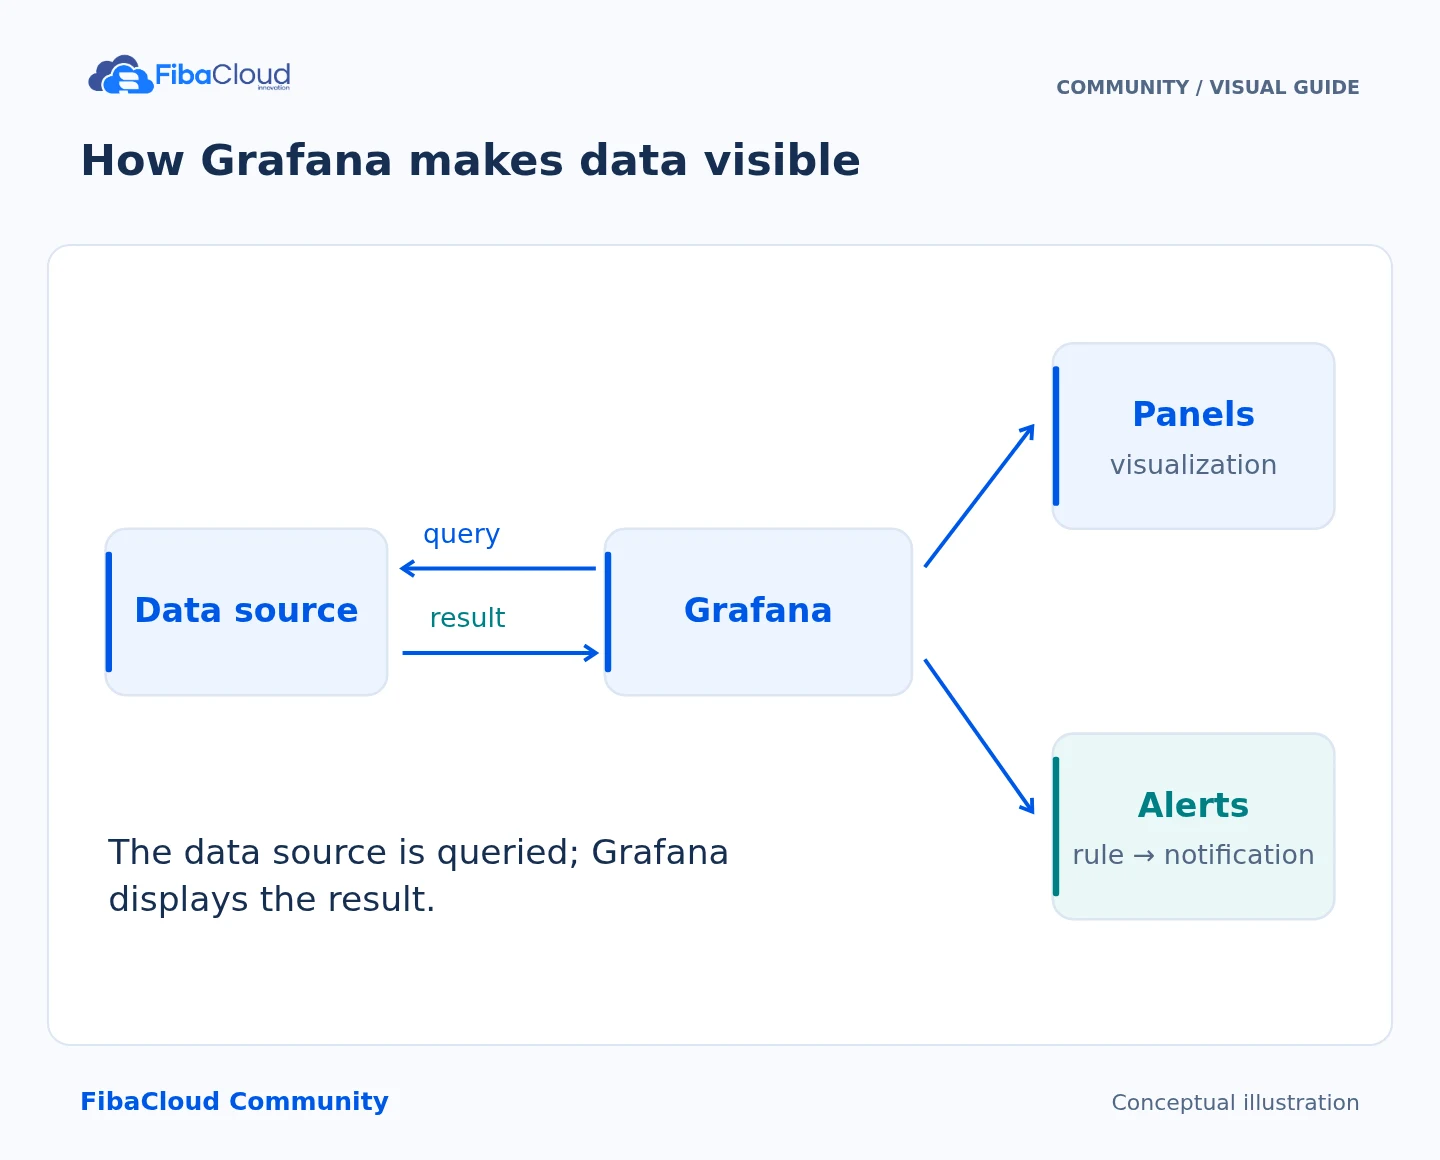
How Grafana makes data visible
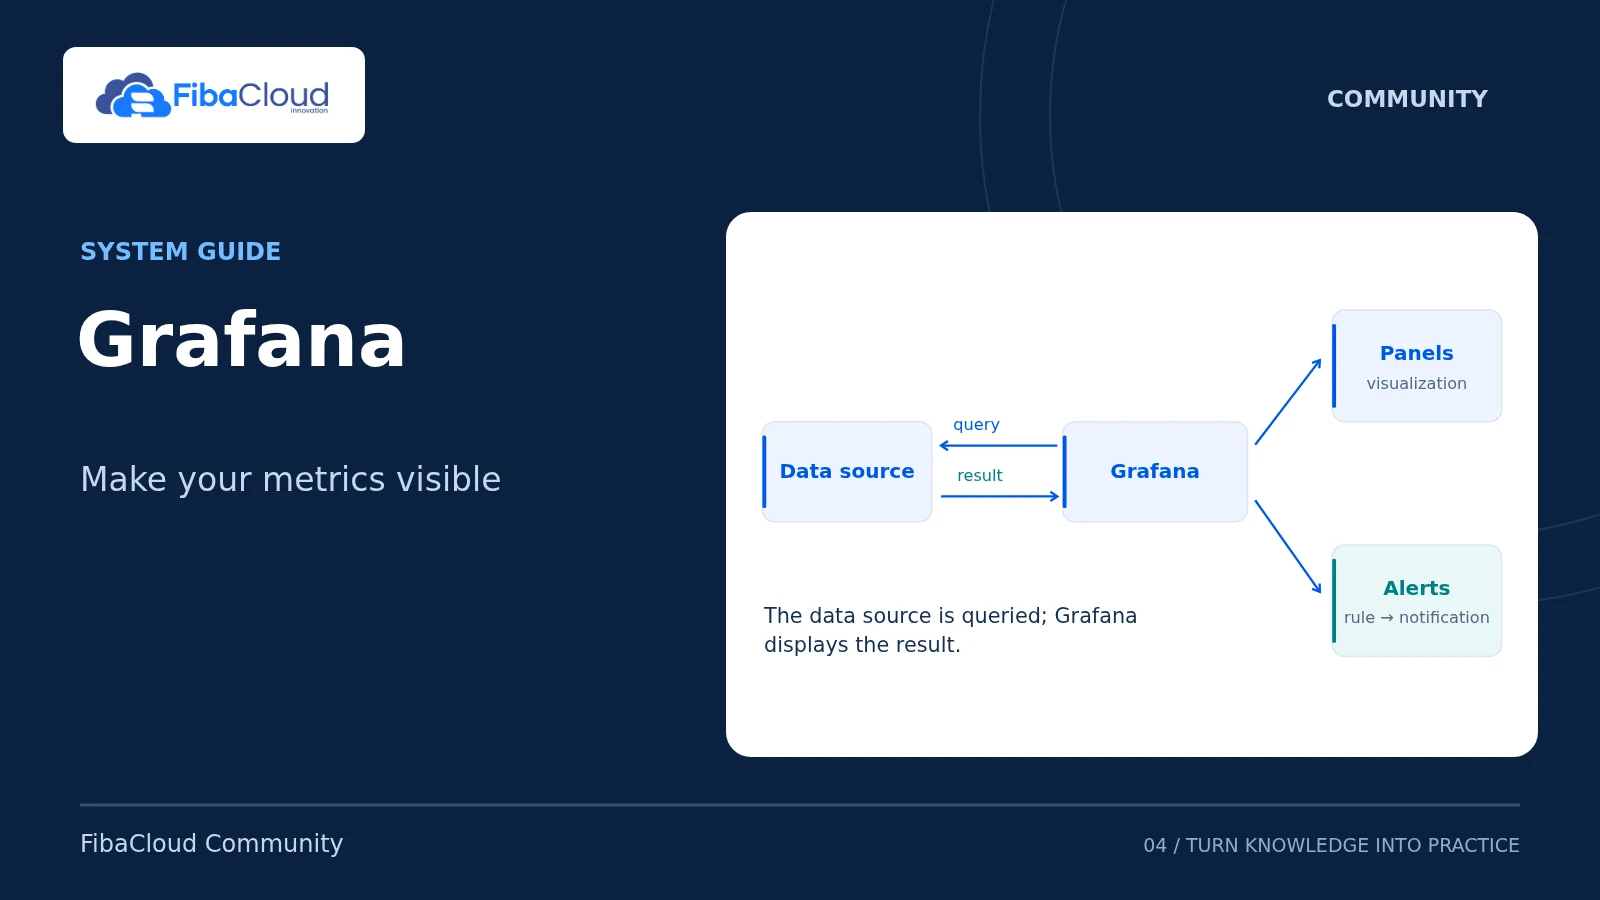
How Grafana makes data visible Grafana queries a connected data source and displays results in panels. Alert rules evaluate results from supported data sources.
Step-by-step explanation
  1. Connect: Configure a compatible data source.
  2. Query: Select a metric and time window.
  3. Visualize: Turn results into clear panels.
  4. Alert: Notify when a rule requires attention.

Before you begin

You need sudo privileges, console/SSH access and a saved configuration backup. If Grafana or its database already exists, use the documented upgrade and plugin-compatibility procedures rather than treating it as a new installation.

cat /etc/os-release
dpkg-query -W 'grafana*' 2>/dev/null
ss -lnt | awk '$4 ~ /:3000$/ {print}'
sudo apt-get update
sudo apt-get install ca-certificates curl gnupg

This example uses loopback and an SSH tunnel without exposing port 3000 publicly. Shared HTTPS access requires a reverse proxy, correct root_url and an appropriate authentication design.

Add the official Grafana repository

Use the key and stable repository in the official Debian/Ubuntu guide. The OSS package is grafana; Enterprise is grafana-enterprise. Do not select them interchangeably within one installation.

key_dir=$(mktemp -d)
curl --fail --show-error --location https://apt.grafana.com/gpg-full.key \
  -o "$key_dir/grafana.asc"
gpg --show-keys --with-fingerprint "$key_dir/grafana.asc"
sudo install -d -m 755 /etc/apt/keyrings
sudo install -m 644 "$key_dir/grafana.asc" /etc/apt/keyrings/grafana.asc
printf '%s\n' 'deb [signed-by=/etc/apt/keyrings/grafana.asc] https://apt.grafana.com stable main' \
  | sudo tee /etc/apt/sources.list.d/grafana.list
sudo apt-get update
apt-cache policy grafana

Match the key source to the official documentation. Do not bypass a signature failure. Confirm that the APT candidate comes from apt.grafana.com stable and record the version you will install. apt-get update refreshes package indexes; it does not, by itself, upgrade an installed Grafana package.

Start the service with local access

On a new installation, prevent package installation from starting the service prematurely:

sudo systemctl mask grafana-server.service
sudo apt-get install grafana
sudo install -d -m 755 /etc/systemd/system/grafana-server.service.d
printf '%s\n' '[Service]' 'Environment=GF_SERVER_HTTP_ADDR=127.0.0.1' \
  'Environment=GF_USERS_ALLOW_SIGN_UP=false' \
  'Environment=GF_AUTH_ANONYMOUS_ENABLED=false' \
  | sudo tee /etc/systemd/system/grafana-server.service.d/local-access.conf
sudo systemctl daemon-reload
sudo systemctl unmask grafana-server.service
sudo systemctl enable --now grafana-server.service
sudo systemctl status grafana-server.service --no-pager
dpkg-query -W -f='${Package} ${Version}\n' grafana
ss -lnt | awk '$4 ~ /:3000$/ {print}'
curl --fail --show-error http://127.0.0.1:3000/api/health

/api/health should report a healthy database; the listener must be only 127.0.0.1:3000. Environment variables in the systemd drop-in override Grafana configuration values: do not change a value in grafana.ini and forget an existing override. Do not edit /usr/share/grafana/conf/defaults.ini, which packages may replace.

Open the first session through SSH

On your own computer, substitute the example user and host with your server’s verified identity:

ssh -N -L 13000:127.0.0.1:3000 [email protected]

Open http://127.0.0.1:13000 in your browser. On an unchanged new installation, replace the default administrator password immediately after the first login with a strong, unique password. Do not share the administrator account for everyday viewing or application integrations. Do not assume default credentials apply to an existing environment.

Verify a data source and dashboard

Begin with Grafana’s TestData source to create a synthetic panel. Add TestData under Connections/Data sources, select it in a new dashboard’s time-series panel, choose a scenario and save both panel and dashboard. Reopening it should display the saved configuration and expected synthetic data. That proves the initial visualization flow, not that your actual infrastructure is monitored.

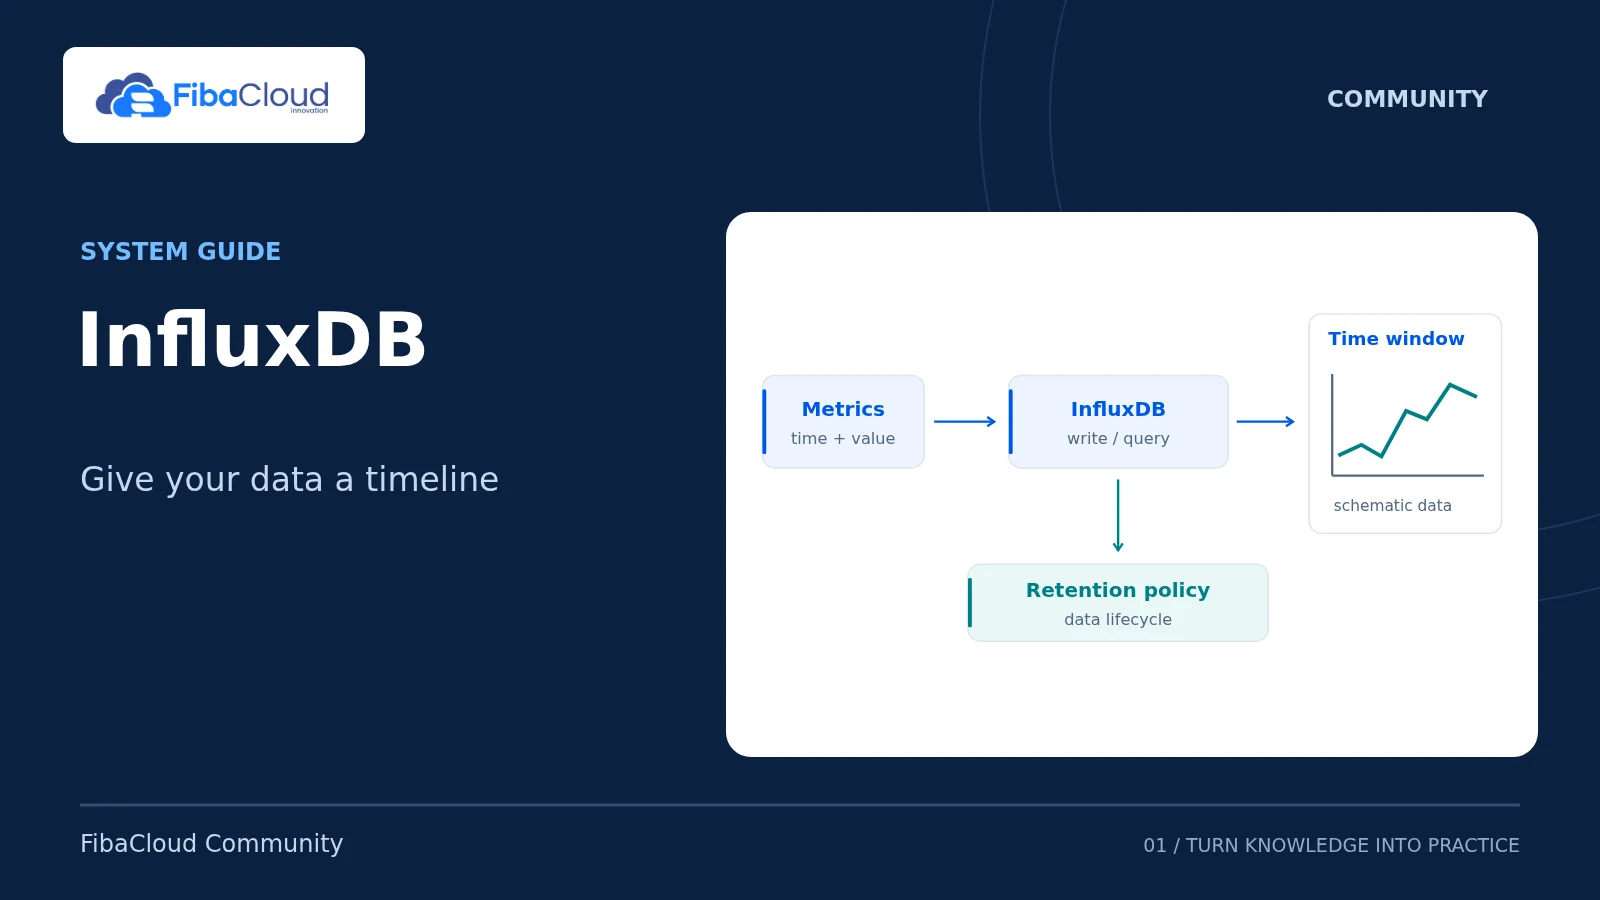
For real data, if you followed the InfluxDB 2.x guide, select an InfluxDB source, choose Flux as the query language, organization fibacloud-lab and default bucket metrics_lab. Use a separate token with read-only access to that bucket. Do not give a dashboard an operator/admin or write token.

When both services run on the same server, the data-source URL can be http://127.0.0.1:8086. This is the Grafana server’s loopback address, not the browser’s. A separate host/container needs the correct private-network address and TLS. Check Save & test, then query the usage_user field of the cpu measurement in the relevant time range. For an empty panel, check the range, synchronized clocks, bucket and token privileges first.

Troubleshooting, backups and rollback

For startup failures, inspect sudo journalctl -u grafana-server -n 80 --no-pager, port conflicts and drop-in values. Resolve networking, CA or permission problems instead of disabling TLS validation or supplying an administrator token to a failing data source.

Back up configuration, provisioning files, the plugin inventory and Grafana’s database with appropriate consistency. A dashboard JSON export alone does not back up users, secrets or the complete server state. Before upgrading, verify data-source/plugin compatibility and restoration in a separate environment. Stop a failed new installation without deleting its data. Do not try to undo database migrations with an ordinary package downgrade.

Sources

Technical content and sources reviewed on October 4, 2026. Recheck the relevant official documentation when a version or provider changes.

Leave a Reply

Your email address will not be published. Required fields are marked *