
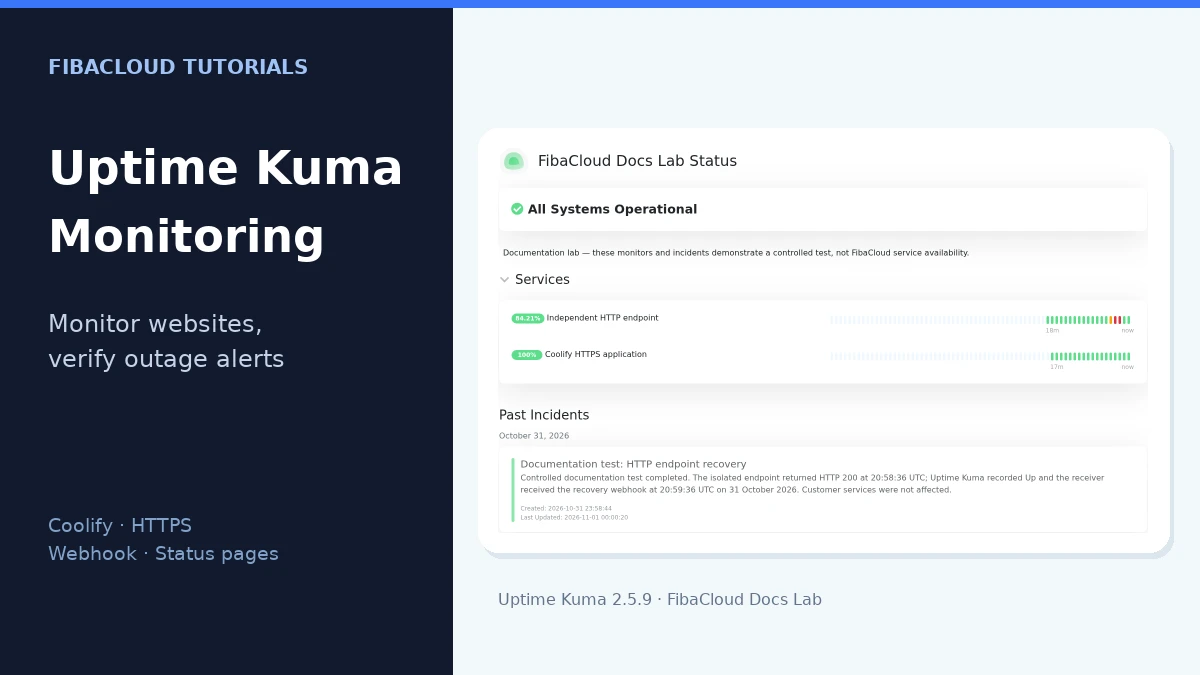
Uptime Kuma is an open-source monitoring tool that checks your websites and services at regular intervals and can notify you when a check fails. In this guide, we will add Uptime Kuma to an existing Coolify server, sign in over HTTPS, and configure an HTTP monitor, a webhook notification and a public status page. We will then observe a controlled application failure and recovery, back up the persistent data and test restoring it.
A green indicator on a dashboard is only part of the job. You also need to check that the monitor uses the right target, changes state during a failure and delivers its notification. The practical sections below cover those steps together.
Test environment and prerequisites
This installation path requires a working Coolify dashboard and server connection. If you are starting with a fresh VPS, complete Install Coolify on a VPS and Deploy Your First App first. We will use the existing proxy; a second web server will not be bound to the same ports 80 and 443.
The installation was performed on 31 October 2026 on a FibaCloud VPS running Ubuntu 24.04.5 LTS, with 2 vCPUs and a 4 GB memory plan. It used the existing Coolify installation; the monitored test application was installed on a separate VPS. This setup is not a capacity limit or a guarantee for a particular number of websites.
| Component | Verified version or selection |
|---|---|
| Uptime Kuma | 2.5.9; official rootless image pinned by digest. |
| Database | SQLite selected in the first-run setup screen. |
| Coolify | 4.5.3. |
| Docker / Compose | 29.9.2 / 5.6.1. |
Verified outcome: the lab checked HTTPS and two-factor login, the live WebSocket connection, two HTTP/HTTPS monitors, Down/Up webhook delivery during a real HTTP 503 drill, a public status page, and same-host restoration from a full data backup. Installation began on 31 October; final checks completed on 1 November 2026 in Turkey time.
- Permission to create projects and resources in Coolify, plus SSH and administrative access to the VPS.
- A subdomain pointing to the VPS public IP address. Replace
uptime.example.comwith your own hostname. Correct any AAAA record that points to an unrelated IPv6 address. - A web address you own and a separate test application that you can safely interrupt.
- A webhook receiver under your control for notification testing. This guide does not use another person’s notification address or a public webhook collection service.
- Enough disk space for a data backup and a private location for a copy outside the server.
For remote access, see How to Connect to a Remote Server with SSH. If images, containers and volumes are new to you, Install Docker and Deploy an App on Ubuntu explains those building blocks.
Where should Uptime Kuma run?
Uptime Kuma sends each check from the server where it runs. If it shares a VPS with the application, it can observe an application failure. If that VPS shuts down entirely, the monitor also stops and cannot send a new alert. To monitor external availability, run Kuma on a server independent of the target, preferably somewhere that does not share the same likely network or provider failure.
An HTTP check measures the response from a particular address. A home page returning 200 does not prove that sign-in, checkout or database writes work. If your application has a health endpoint that checks its real dependencies without exposing sensitive data, you can monitor that endpoint separately.
| Check | What it shows | What it does not establish by itself |
|---|---|---|
| HTTP/HTTPS | Whether the selected URL returns an accepted HTTP response. | That every user workflow succeeds. |
| Application health endpoint | The state of dependencies actually checked by that endpoint. | Workflows omitted from its health check. |
| Status page | The monitors you choose to share and the incident updates you publish. | Independent incident communication when the monitoring server is unreachable. |
In this guide’s test, Kuma and its target application run on separate VPSs. Access from the monitoring server to the target’s /health address was verified with an HTTP 200 response. We will trigger the controlled failure on that target. Separate servers can still share a provider or common network dependencies.
Create the Uptime Kuma service in Coolify
We will enter a Docker Compose definition in Coolify so the selected image and persistent data mount are visible in one resource. HTTP monitoring does not require access to the Docker socket.
- Open Projects and create a monitoring project or select an existing one. The test used a new project named
FibaCloud Monitoring Lab; itsproductionenvironment was created automatically. - Select New Resource in that environment.
- Choose Deploy on the Docker Compose card. This creates a service from a Compose definition without connecting a Git repository.
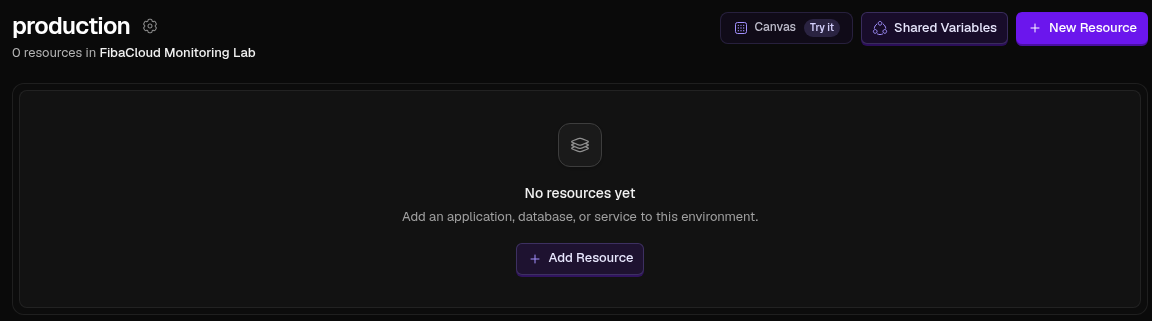
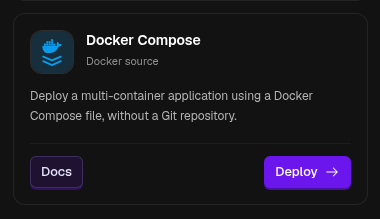
Paste the following definition into Docker Compose file and select Create Service. It is intended for a fresh installation with a new volume. The initial configuration publishes no hostname and binds port 13001 only to the VPS loopback address.
services:
  uptime-kuma:
    image: louislam/uptime-kuma:2.5.9-rootless@sha256:ea1b2ceb6ef710a3d0d994debcc8cded062e534fb901f6e895f59caad68e0a9e
    restart: unless-stopped
    ports:
      - "127.0.0.1:13001:3001"
    volumes:
      - uptime-kuma-data:/app/data
    security_opt:
      - no-new-privileges:true
    labels:
      - "traefik.enable=false"

volumes:
  uptime-kuma-data:
Choose a descriptive name under General → Service name; the test used FibaCloud Uptime Kuma. Select Save changes. Leave Network attachment set to Use the stack network only.
Check that Domains has no configured hostname. Keep traefik.enable=false for this step, then select Deploy. Watch Runtime Logs and the resource status until the service starts. On the first run, waiting for a user to choose the database is expected.
The test confirmed that the image ran as node with UID/GID 1000:1000, the new data volume was writable and the service health check passed. No additional root container or manual ownership change was needed. This result does not cover moving an existing v1 data directory to a rootless image.
/app/data contains Uptime Kuma’s persistent data. Keep the same volume attached when recreating the container. Do not leave the data in the container’s disposable filesystem; the official installation instructions do not support network filesystems such as NFS for this data.
Protect the first administrator setup
Do not leave a fresh installation’s first-account form publicly accessible. Create the administrator through a connection restricted to you, then publish the HTTPS hostname. Choose a unique password and save it in a password manager.
Run the following command on your own computer, not on the VPS. Replace 203.0.113.10 with the IP address of the Kuma server and, if necessary, replace root with your SSH user. Keep the terminal open:
ssh -N -L 127.0.0.1:13001:127.0.0.1:13001 [email protected]
Open http://localhost:13001 in your browser. Access between your computer and the remote server goes through this SSH tunnel. If local port 13001 is already in use, change only the first local port number and use that new port in the browser.
- The first screen asks Which database would you like to use? Select SQLite for the single-database-file setup used here.
- Select Next. After database preparation, the Create your admin account form opens.
- Fill in Username, Password and Repeat Password, then select Create.
- Confirm that Dashboard opens. A fresh installation shows No Monitors, please add one because you have not created any monitors yet.
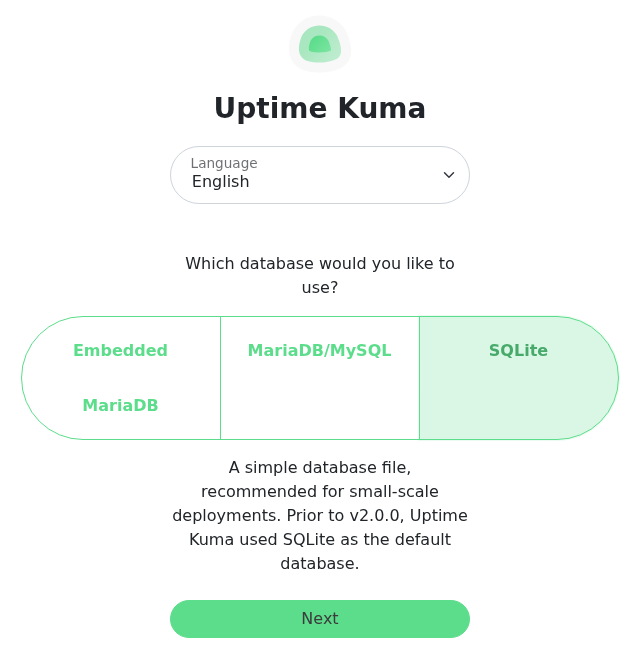
The test completed this sequence and opened an empty Dashboard after administrator creation. During initial setup, direct access remained bound to 127.0.0.1:13001 and no public proxy route had been added.
After creating the account, open Settings → Security → 2FA Settings. Enter your password in Current Password and click Enable 2FA. Scan the generated QR code with your authenticator, enter its current code, and complete Verify Token → Save → Yes. The tested account changed to Active. Keep the QR code and setup secret out of shared documents.
Check a fresh login separately. In this test, a new HTTPS session asked for a Token after the username and password; entering the valid code and selecting Log in opened the Dashboard.
Finish the hostname and HTTPS configuration
Point your subdomain’s DNS record to the Kuma VPS. Open the service’s Domains → Add Domain screen in Coolify and enter:
| Field | Value |
|---|---|
| Service application | uptime-kuma |
| Protocol | https |
| Domain | Your hostname, such as uptime.example.com, without a scheme or port. |
| Port | 3001 |
| Path | Leave empty. |
Select Save. In General → Edit Compose File, remove the bootstrap-only traefik.enable=false label and the labels: line if it would otherwise be empty. Preserve the other image, volume and port settings, save the Compose change and redeploy the service.
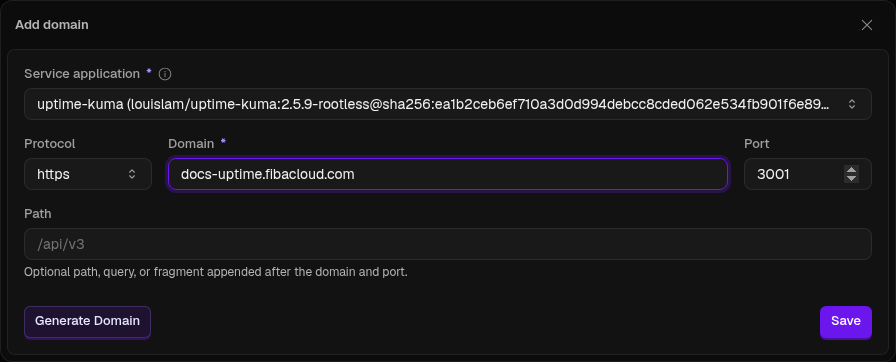
Open https://uptime.example.com in the browser without adding :3001. The 127.0.0.1:13001 binding can remain for private maintenance access; it does not need to be published on 0.0.0.0.
The tested hostname, docs-uptime.fibacloud.com, served a trusted Let’s Encrypt certificate on port 443 and redirected HTTP to HTTPS. A fresh browser session completed two-factor login, and its wss:// WebSocket exchanged data. This checked the dashboard’s live connection as well as its HTML response.
The Uptime Kuma dashboard uses a live connection. If the page loads but reports connection errors, check more than the HTML response: the proxy must also pass WebSocket traffic. Use a dedicated subdomain instead of mounting the application under a subdirectory such as /uptime.
The dashboard and status page can share a hostname. Your account protects the management area while only the selected status page is public. Check that distinction in a separate browser window without an authenticated session.
Prepare a separate HTTP target for the failure test
You can monitor your own website without this small application. To test failure and recovery under controlled conditions, run the target below on a separate test VPS. Its /health address normally returns 200 and returns 503 only while a maintenance file created through SSH is present.
Download the test target and webhook receiver source package. It contains the Python sources, Dockerfiles and Compose definitions used in this guide, without passwords, real event logs or application backups. The command below verifies the archive hash and its source-file checksums.
Run this step on the second VPS, with Docker, Compose, curl and unzip available. It stops if the directory, container, network or port 18889 is already in use; inspect an existing installation instead of deleting it to proceed.
sudo bash <<'TARGET_SETUP'
set -euo pipefail
umask 077
if [ -e /root/fibacloud-uptime-target ] || \
   docker container inspect fibacloud-uptime-target >/dev/null 2>&1 || \
   docker image inspect fibacloud-uptime-target:20261031 >/dev/null 2>&1 || \
   docker network inspect fibacloud-uptime-target_default >/dev/null 2>&1; then
  echo 'Example namespace already exists; inspect it before continuing.' >&2
  exit 1
fi
if [ -n "$(ss -H -ltn 'sport = :18889')" ]; then
  echo 'TCP 18889 is already in use.' >&2
  exit 1
fi
install -d -m 0700 /root/fibacloud-uptime-target
cd /root/fibacloud-uptime-target
curl -fSL 'https://www.fibacloud.com/community/tutorials/wp-content/uploads/2026/10/fibacloud-uptime-kuma-20261031/uptime-kuma-examples.zip' -o examples.zip
printf '%s  examples.zip\n' '74f3d8808903f7d53266ebff1ce056fc5185eae1027031b190a688c57b9e959d' | sha256sum -c -
unzip -q examples.zip -d package
(cd package && sha256sum -c SHA256SUMS)
install -m 0600 package/target/Dockerfile package/target/compose.yaml package/target/target.py .
install -d -m 0755 state
docker compose config --quiet
docker compose up -d --build
docker compose ps
TARGET_SETUP
Check the HTTP response on the target server:
curl --retry 10 --retry-connrefused --retry-delay 1 --retry-max-time 30 -fsS http://127.0.0.1:18889/health
The running target returns {"status":"ok","service":"fibacloud-uptime-target"}. Next, test access from the Kuma VPS using the target’s public IP address. Replace the example IP below with your second VPS:
curl -fsS -w '\nHTTP %{http_code}\n' http://203.0.113.20:18889/health
The separate-server check returned HTTP 200 in this test. If it cannot connect, check access to 18889/TCP in the target server’s and provider’s network rules. This port serves only a fixed test response; monitor your real application’s health endpoint through its own HTTPS configuration.
Add the first HTTP/HTTPS monitor
Give the monitor a descriptive name. When you monitor several applications, names such as Customer portal — sign-in page or API — health endpoint make a notification easier to identify than a generic Website label.
Select Add New Monitor, choose HTTP(s) under Monitor Type, and enter a Friendly Name and your target URL. The test created two separate monitors:
| Monitor | Target | Scope |
|---|---|---|
| Independent HTTP endpoint | http://194.116.236.155:18889/health on a separate VPS |
The controlled 503 failure test. This public HTTP endpoint carries no confidential data and does not test certificates. |
| Coolify HTTPS application | https://docs-coolify-app.fibacloud.com/health |
The HTTPS response of the application from our previous Coolify guide. This application shares the Kuma VPS, so this monitor cannot independently detect that entire VPS shutting down. |
These addresses identify the guide’s test environment. Use your own targets in your installation; you can use the separate target created above for the first monitor.
| Setting | Value used in the test |
|---|---|
| Heartbeat Interval | 60 seconds |
| Retries | 1 |
| Heartbeat Retry Interval | 20 seconds |
| Request Timeout | 5 seconds |
| Resend Notification if Down X times consecutively | 0; repeated notifications during an ongoing failure are disabled. |
| HTTP Options → Method | GET |
| Accepted Status Codes | 200-299 |
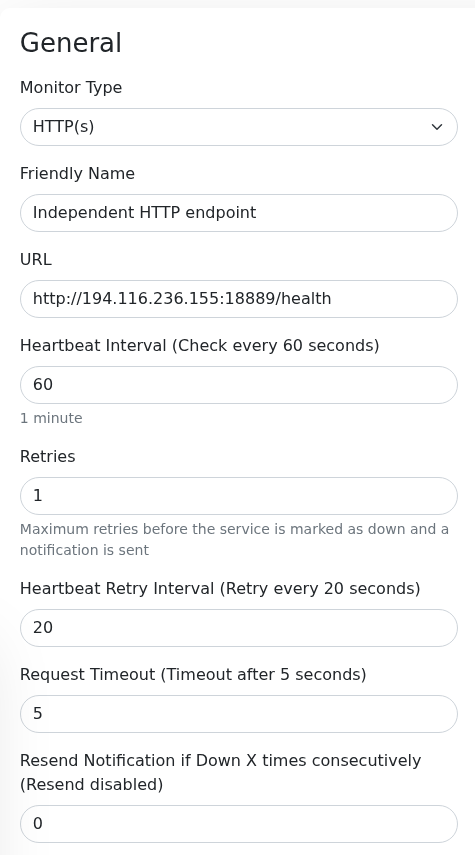
For the HTTPS target, Certificate Expiry Notification was enabled and Ignore TLS/SSL errors for HTTPS websites was left off. Do not hide certificate errors just to obtain a green state. This guide did not create an expired certificate to test its alert; it verified real HTTPS access with these settings. Domain Name Expiry Notification is disabled for both monitors.
Select Save and wait for the first check. Set the fields explicitly instead of assuming which defaults a new monitor uses.
The check interval determines how often a new request is sent. The timeout limits how long an individual request can wait, while retries affect additional attempts before a failed check changes the state. Shorter intervals generate more requests. Choose values that fit your expected response times and alerting needs; overly aggressive values can turn brief network delays into noisy alarms.
If the target normally returns 200, verify that behavior. An application that serves its error page with status 200 can still look healthy to a basic HTTP check. Use a meaningful health endpoint or a separate response-content check for that case.
Both monitors reached Up with an HTTP 200 response on their first check. The screenshot below shows the independent VPS target’s first successful check.
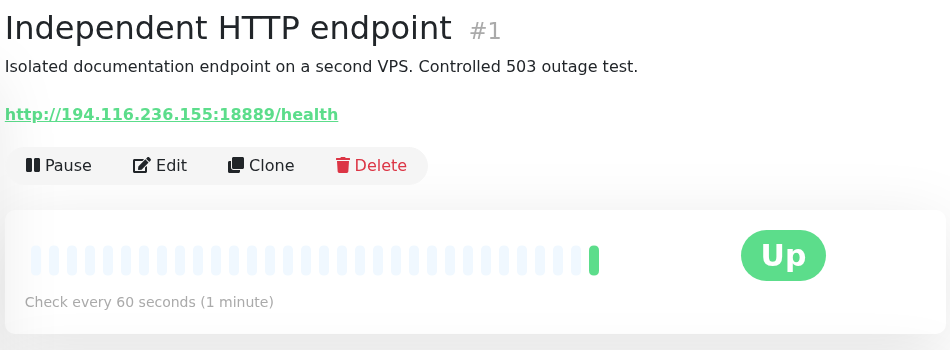
A newly created monitor’s percentage figures are not a long-term service history. Labels such as 24 hours, 30 days or one year do not mean that measurements have already been collected for those periods.
Add a webhook notification and verify delivery
A webhook sends an HTTP request to the address you configure when the monitor changes state. Saving a notification in Kuma and processing that request at the receiver are separate steps. Check the test both in the Kuma interface and in the receiver’s records.
Start the private test receiver
Install the receiver from the source package on the Kuma VPS. This small service runs only on a private Docker network and publishes no host port. It records the notification type, time and state so that we can verify actual arrival.
sudo bash <<'RECEIVER_SETUP'
set -euo pipefail
umask 077
if [ -e /root/fibacloud-uptime-lab ] || \
   docker container inspect fibacloud-uptime-webhook >/dev/null 2>&1 || \
   docker image inspect fibacloud-uptime-webhook:20261031 >/dev/null 2>&1 || \
   docker network inspect fibacloud-uptime-webhook >/dev/null 2>&1 || \
   docker volume inspect fibacloud-uptime-webhook-events >/dev/null 2>&1; then
  echo 'Example namespace already exists; inspect it before continuing.' >&2
  exit 1
fi
install -d -m 0700 /root/fibacloud-uptime-lab/receiver
cd /root/fibacloud-uptime-lab/receiver
curl -fSL 'https://www.fibacloud.com/community/tutorials/wp-content/uploads/2026/10/fibacloud-uptime-kuma-20261031/uptime-kuma-examples.zip' -o examples.zip
printf '%s  examples.zip\n' '74f3d8808903f7d53266ebff1ce056fc5185eae1027031b190a688c57b9e959d' | sha256sum -c -
unzip -q examples.zip -d package
(cd package && sha256sum -c SHA256SUMS)
install -m 0600 package/receiver/Dockerfile package/receiver/compose.yaml package/receiver/receiver.py .
docker compose config --quiet
docker compose up -d --build
docker compose ps
RECEIVER_SETUP
Once docker compose ps reports the receiver as healthy, open General → Edit Compose File for the Kuma service in Coolify. With the administrator already created, preserve the HTTPS domain setting and save the following complete Compose definition:
services:
  uptime-kuma:
    image: louislam/uptime-kuma:2.5.9-rootless@sha256:ea1b2ceb6ef710a3d0d994debcc8cded062e534fb901f6e895f59caad68e0a9e
    restart: unless-stopped
    ports:
      - "127.0.0.1:13001:3001"
    volumes:
      - uptime-kuma-data:/app/data
    security_opt:
      - no-new-privileges:true
    networks:
      - webhook
volumes:
  uptime-kuma-data:
networks:
  webhook:
    external: true
    name: fibacloud-uptime-webhook
Leave Network attachment set to Use the stack network only. Select Save changes and redeploy the service. Kuma keeps its existing persistent volume; the added webhook network lets it reach the private receiver. Coolify manages the connection to its proxy network.
The receiver’s container health check and HTTP 200 response were verified in the test. It has no publicly published port. The webhook-receiver name is therefore resolved by Kuma on the shared Docker network, not by your browser.
Attach the notification to the monitor
Open Settings → Notifications → Set Up Notification and enter these settings:
| Field | Tested selection |
|---|---|
| Notification Type | Webhook |
| Friendly Name | Docs Lab Webhook |
| Post URL | http://webhook-receiver:8080/events |
| HTTP Method | POST |
| Request Body | Preset – application/json |
| Additional Headers | Off; this receiver is reachable only through its private Docker network. |
| Default enabled | Off; new monitors do not inherit this notification automatically. |
| Apply on all existing monitors | On; assigns the notification to the two existing test monitors. |
Explicitly select Preset – application/json in Request Body. In the first form opened during the test, this required field was empty: a Test request arrived, but browser validation blocked Save. Selecting the option allowed the notification to be saved.
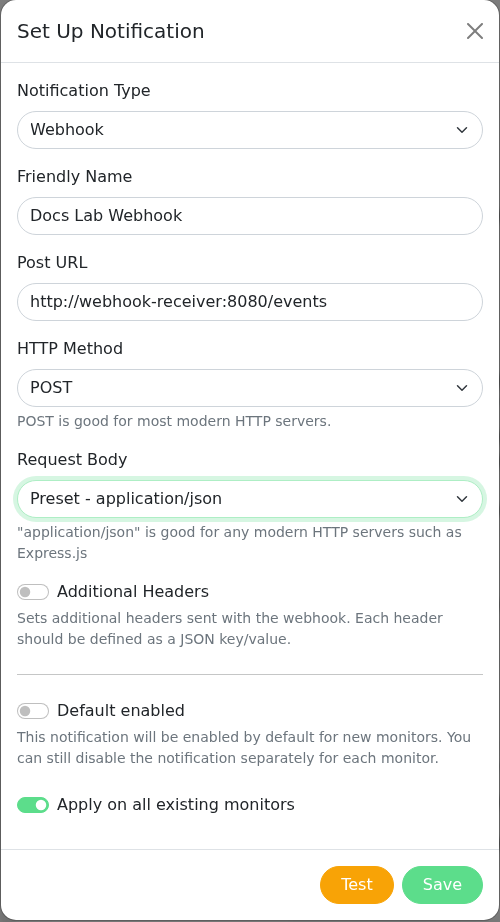
Click Test, confirm success, then click Save. On the Kuma VPS, read the receiver’s event records:
sudo docker exec fibacloud-uptime-webhook cat /data/events.jsonl
The actual test request reached the receiver at 20:53:25 UTC on 31 October 2026 and was recorded as kind: test. That proves the connection test; the outage drill below separately checks Down and Up delivery. If you do not want to assign it to every existing monitor, leave the bulk option off and enable the intended notification in each relevant monitor’s edit screen.
If the webhook URL or an additional header contains an access token, keep it out of screenshots and shared documents. When you connect the receiver to another automation, check more than its HTTP success response: confirm the correct service, state and timestamp reached the intended workflow.
This guide tests delivery to a controlled webhook receiver. If you choose Telegram, Discord, SMTP or another notification method, configure your own account details and perform a separate real delivery test for that channel.
Test a controlled failure and recovery
Use a dedicated test target for this step, away from customer traffic. Temporarily make that target return a failing response. Stopping Kuma itself or the shared proxy would change the scope of an application-failure test.
If you installed this guide’s target, run the following command on the second VPS. It creates one maintenance file in the dedicated test directory without restarting the target container:
sudo python3 - <<'PYTHON'
from pathlib import Path
root = Path('/root/fibacloud-uptime-target/state')
assert root.is_dir() and not root.is_symlink()
flag = root / 'maintenance'
assert not flag.exists() and not flag.is_symlink()
with flag.open('x') as stream:
    stream.write('Controlled FibaCloud documentation test\n')
flag.chmod(0o644)
PYTHON
curl -sS -w '\nHTTP %{http_code}\n' http://127.0.0.1:18889/health
The response should show HTTP 503. Keep Independent HTTP endpoint open in Kuma. After the configured retry, wait for Down and a status: 0 event at the receiver. Then remove only this drill’s maintenance file on the same target VPS:
sudo python3 - <<'PYTHON'
from pathlib import Path
root = Path('/root/fibacloud-uptime-target/state')
assert root.is_dir() and not root.is_symlink()
flag = root / 'maintenance'
assert flag.is_file() and not flag.is_symlink()
assert flag.read_text() == 'Controlled FibaCloud documentation test\n'
flag.unlink()
PYTHON
curl -fsS -w '\nHTTP %{http_code}\n' http://127.0.0.1:18889/health
Once the target returns HTTP 200, wait for Kuma’s next check. Seeing Up and receiving status: 1 are separate checks. Read the receiver records with the docker exec command from the previous section.
The first check after a failure, any retries and notification delivery happen at separate times. The results below describe this experiment with the selected settings; they are not a promise that every outage will be detected in the same number of seconds.
| Observed event | 31 October 2026, UTC |
|---|---|
| Target switched to HTTP 503. | 20:56:41.362 |
| Kuma recorded Down. | 20:57:36.285 |
| Receiver recorded the Down webhook. | 20:57:36.348 |
| Target restored to HTTP 200. | 20:58:36.690 |
| Kuma recorded Up. | 20:59:36.289 |
| Receiver recorded the Up webhook. | 20:59:36.333 |
Using the timestamps recorded by the hosts, Down appeared after about 55 seconds and Up after about 60 seconds. These are observations from one controlled run, not a general latency bound or SLA. The table uses UTC; the dashboard screenshots display Turkey time, UTC+3.
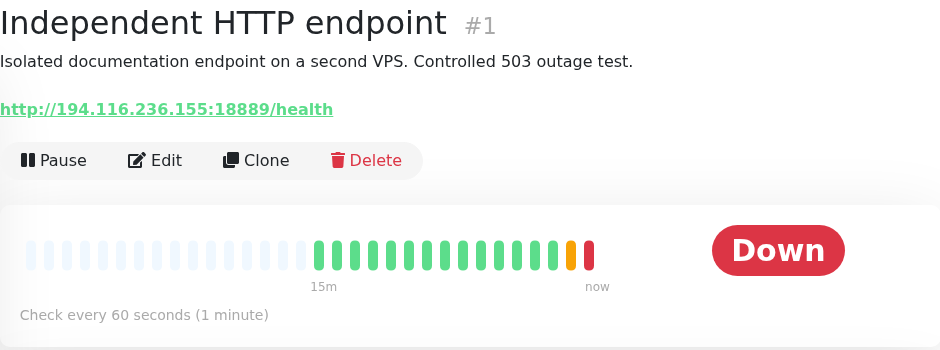
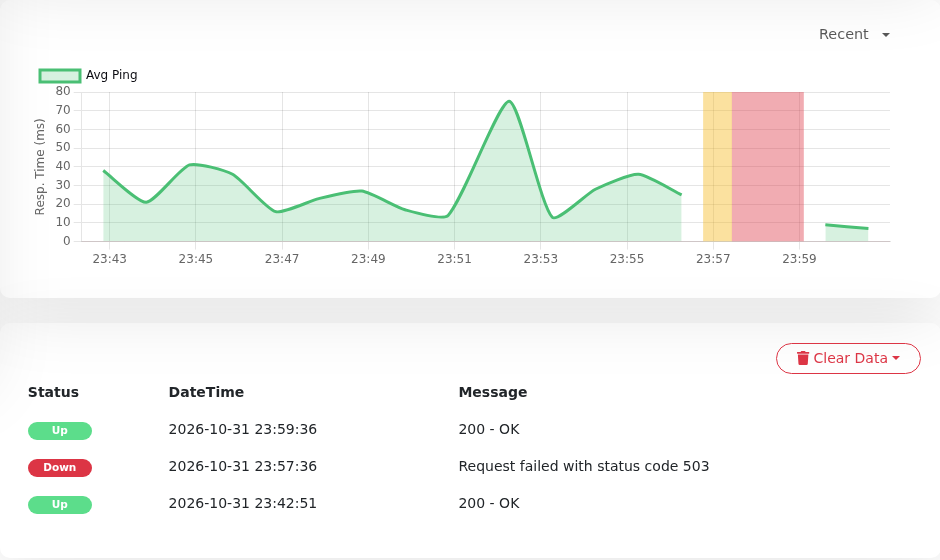
Return the target to a healthy state when the test is complete. Confirm that the monitor reports Up again and that a recovery notification reaches the receiver. A working initial alert does not by itself verify the recovery path.
Create a public status page
Only add monitors that are appropriate to share. Review names containing internal hostnames, private administration endpoints or customer names before publishing them. A service name and its current state are often enough for your users.
- Open Status Pages in the top menu and create a new status page.
- In Add New Status Page, enter Name and Slug, then click Next. The test used
FibaCloud Docs Lab Statusand slugdocs-lab. - Review Title and Description in the editor. The test description explicitly identifies a documentation lab and says it does not represent FibaCloud service availability.
- Select a monitor from Add a monitor; repeat for the second one. The test automatically created a Services group containing both monitors.
- Click Save. Check
https://uptime.example.com/status/docs-labin a signed-out browser, replacing the hostname with your own.
In the test, administration still required login while a separate anonymous browser could open the status page. Both initial monitors were healthy and the page showed All Systems Operational. A few minutes of new history is not evidence of long-term availability.
You can add a short incident update for planned maintenance or an outage under investigation. State the affected service, start time and what is known. Avoid an unconfirmed root cause or a promised resolution time, and update the notice when the issue is resolved.
During the drill, Create Incident was selected in the status-page editor. The Title and Content identified a controlled outage on a separate test target, then Post published the notice. After recovery, Edit updated the text, Post saved it, and Resolve closed the incident.
The final anonymous-browser check showed All Systems Operational, with the completed notice under Past Incidents. It recorded the target’s return to HTTP 200 at 20:58:36 UTC and the verified Kuma and webhook recovery at 20:59:36 UTC.
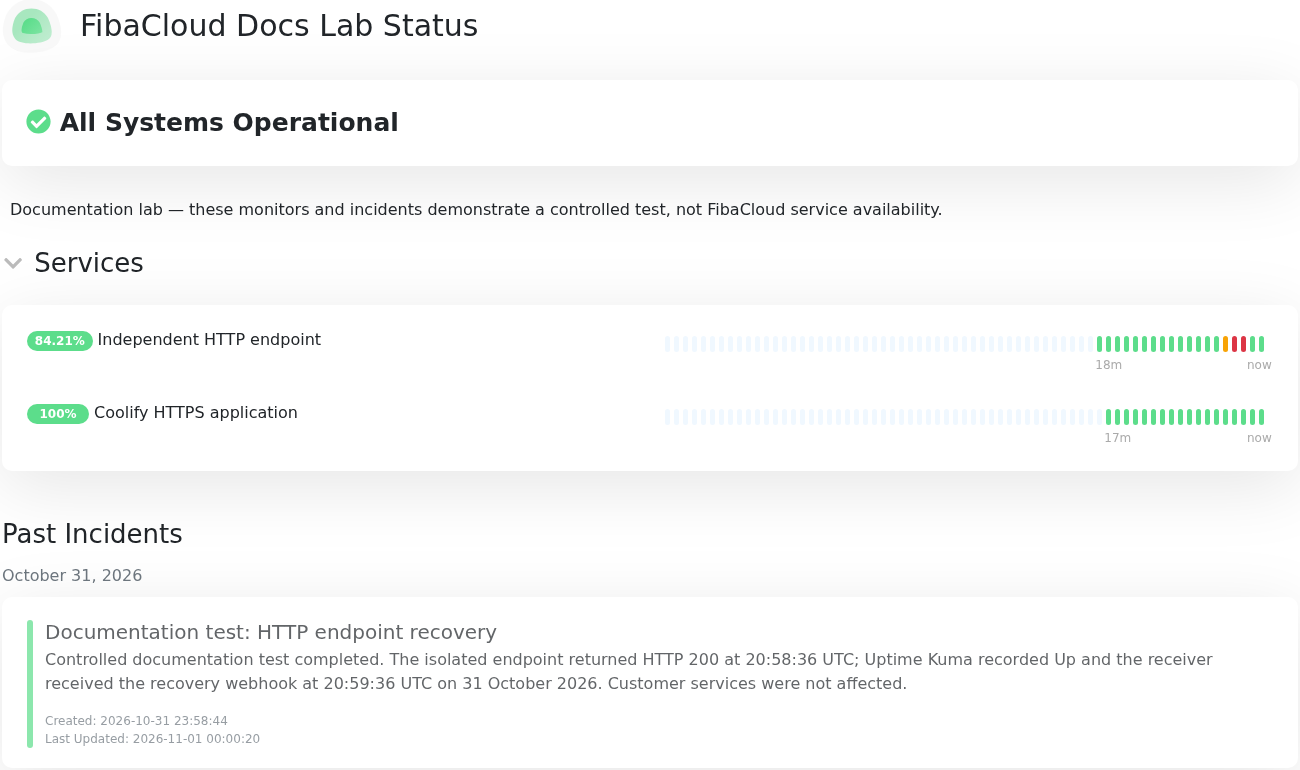
If Kuma and the status page share a server, that server’s failure also takes the page offline. Plan an independent status page or another communication channel if you need to communicate during a complete infrastructure outage.
Back up persistent data and test a restore
A persistent volume keeps data across container replacements; it is not a second copy you can use after losing the server disk. Uptime Kuma 2 removed the old JSON import/export feature. This procedure takes a consistent backup of the complete /app/data contents.
The backup can contain the administrator account, monitor settings, history and notification credentials. Keep it private, restrict access and retain a protected copy outside the server. Screenshots or a Compose file alone are not an application-data backup.
First match the Coolify resource to its running container. On the Kuma VPS, list the containers:
sudo docker ps --format 'table {{.Names}}\t{{.Image}}\t{{.Status}}'
Replace REPLACE_WITH_YOUR_RESOURCE_ID below with your actual resource ID. This recipe adapts the tested stop, full-volume archive and same-container start operations for readers. It targets SQLite and Docker’s default local-volume path; do not apply it directly to another database or data location. Avoid concurrent Coolify deployments while it runs.
sudo bash <<'KUMA_BACKUP'
set -euo pipefail
umask 077
KUMA_CONTAINER='uptime-kuma-REPLACE_WITH_YOUR_RESOURCE_ID'
[[ "$KUMA_CONTAINER" != *REPLACE* ]]
KUMA_ID="$(docker container inspect --format '{{.Id}}' "$KUMA_CONTAINER")"
KUMA_VOLUME="$(docker container inspect --format '{{range .Mounts}}{{if and (eq .Destination "/app/data") (eq .Type "volume")}}{{println .Name}}{{end}}{{end}}' "$KUMA_ID")"
[[ "$KUMA_VOLUME" =~ ^[a-zA-Z0-9][a-zA-Z0-9_.-]+$ ]]
KUMA_DATA="$(docker volume inspect --format '{{.Mountpoint}}' "$KUMA_VOLUME")"
[[ "$KUMA_DATA" == "/var/lib/docker/volumes/$KUMA_VOLUME/_data" ]]
[[ "$(realpath "$KUMA_DATA")" == "$KUMA_DATA" ]]
[[ -f "$KUMA_DATA/kuma.db" && -f "$KUMA_DATA/db-config.json" ]]
[[ "$(docker ps -aq --no-trunc --filter "volume=$KUMA_VOLUME")" == "$KUMA_ID" ]]
[[ "$(docker container inspect --format '{{.State.Running}}' "$KUMA_ID")" == true ]]
KUMA_BACKUP_DIR="$(mktemp -d /root/kuma-backup-XXXXXXXX)"
printf '%s\n' "$KUMA_CONTAINER" > "$KUMA_BACKUP_DIR/container-name.txt"
printf '%s\n' "$KUMA_ID" > "$KUMA_BACKUP_DIR/container-id.txt"
docker container inspect --format '{{.Image}}' "$KUMA_ID" > "$KUMA_BACKUP_DIR/image-id.txt"
printf '%s\n' "$KUMA_VOLUME" > "$KUMA_BACKUP_DIR/volume-name.txt"
docker container inspect --format '{{.Config.Image}}' "$KUMA_ID" > "$KUMA_BACKUP_DIR/image.txt"
trap 'if [[ "$(docker container inspect --format "{{.State.Running}}" "$KUMA_ID")" == false ]]; then docker start "$KUMA_ID" >/dev/null; fi' EXIT
docker stop --time 30 "$KUMA_ID"
[[ "$(docker container inspect --format '{{.State.Running}}' "$KUMA_ID")" == false ]]
[[ -z "$(docker ps -q --filter "volume=$KUMA_VOLUME")" ]]
tar --numeric-owner --acls --xattrs --one-file-system \
  -czpf "$KUMA_BACKUP_DIR/data.tar.gz" -C "$KUMA_DATA" .
chmod 0600 "$KUMA_BACKUP_DIR/data.tar.gz"
(cd "$KUMA_BACKUP_DIR" && sha256sum data.tar.gz > data.sha256)
tar -tzf "$KUMA_BACKUP_DIR/data.tar.gz" > "$KUMA_BACKUP_DIR/members.txt"
docker start "$KUMA_ID"
trap - EXIT
KUMA_HEALTHY=false
for attempt in {1..60}; do
  if [[ "$(docker container inspect --format '{{.State.Running}} {{.State.Health.Status}}' "$KUMA_ID")" == "true healthy" ]]; then
    KUMA_HEALTHY=true
    break
  fi
  sleep 2
done
if [[ "$KUMA_HEALTHY" != true ]]; then
  docker container inspect --format '{{json .State}}' "$KUMA_ID"
  exit 1
fi
printf 'Backup directory: %s\n' "$KUMA_BACKUP_DIR"
KUMA_BACKUP
The command resolves the actual volume from the container’s /app/data mount instead of guessing its name. It stops if another container also uses that volume. Kuma and the status page on this server are briefly unavailable during the backup. If archive reading fails, the exit handler tries to restart the same container; check the output and resulting service state.
Keep the printed /root/kuma-backup-… directory. Its data.tar.gz, checksum and resource-identity files are used together during restoration. The recipe waits up to roughly two minutes for healthy; if that wait fails, it exits with an error and displays the container state.
The real backup included kuma.db, db-config.json, docker-tls, screenshots, upload and the data-directory metadata, preserving ownership and permissions. An encrypted copy was also stored privately on another server, then decrypted and verified against the file hashes and archive members. Use your own backup system to keep an encrypted off-host copy and test reading it; the command above creates only the local backup.
Restore on the same server
A restore returns the data to the state in the chosen backup. Records created after that backup may not survive. Before starting, take a separate copy of the current data and verify that you selected the correct volume.
After the backup, the test created a third monitor named Restore canary - created after backup, left its notifications disabled, and paused it. This provides a recovery marker that a simple restart cannot reproduce: loading the earlier backup must remove the newly created monitor.
Replace both variables below with your container and the backup directory created above. This recipe requires the same container ID, image and volume; it is not a migration to another server. Use only your own trusted archive with its verified checksum.
sudo bash <<'KUMA_RESTORE'
set -euo pipefail
umask 077
KUMA_CONTAINER='uptime-kuma-REPLACE_WITH_YOUR_RESOURCE_ID'
KUMA_BACKUP_DIR='/root/kuma-backup-REPLACE_WITH_YOUR_DIRECTORY'
[[ "$KUMA_CONTAINER$KUMA_BACKUP_DIR" != *REPLACE* ]]
[[ -d "$KUMA_BACKUP_DIR" && ! -L "$KUMA_BACKUP_DIR" ]]
[[ "$(realpath "$KUMA_BACKUP_DIR")" == "$KUMA_BACKUP_DIR" ]]
[[ "$(cat "$KUMA_BACKUP_DIR/container-name.txt")" == "$KUMA_CONTAINER" ]]
(cd "$KUMA_BACKUP_DIR" && sha256sum -c data.sha256)
KUMA_ID="$(docker container inspect --format '{{.Id}}' "$KUMA_CONTAINER")"
[[ "$KUMA_ID" == "$(cat "$KUMA_BACKUP_DIR/container-id.txt")" ]]
[[ "$(docker container inspect --format '{{.Image}}' "$KUMA_ID")" == "$(cat "$KUMA_BACKUP_DIR/image-id.txt")" ]]
[[ "$(docker container inspect --format '{{.Config.Image}}' "$KUMA_ID")" == "$(cat "$KUMA_BACKUP_DIR/image.txt")" ]]
KUMA_VOLUME="$(docker container inspect --format '{{range .Mounts}}{{if and (eq .Destination "/app/data") (eq .Type "volume")}}{{println .Name}}{{end}}{{end}}' "$KUMA_ID")"
[[ "$KUMA_VOLUME" =~ ^[a-zA-Z0-9][a-zA-Z0-9_.-]+$ ]]
[[ "$KUMA_VOLUME" == "$(cat "$KUMA_BACKUP_DIR/volume-name.txt")" ]]
KUMA_DATA="$(docker volume inspect --format '{{.Mountpoint}}' "$KUMA_VOLUME")"
[[ "$KUMA_DATA" == "/var/lib/docker/volumes/$KUMA_VOLUME/_data" ]]
[[ "$(realpath "$KUMA_DATA")" == "$KUMA_DATA" ]]
[[ "$(docker ps -aq --no-trunc --filter "volume=$KUMA_VOLUME")" == "$KUMA_ID" ]]
python3 - "$KUMA_BACKUP_DIR/data.tar.gz" <<'ARCHIVE_CHECK'
import sys, tarfile
from pathlib import PurePosixPath
with tarfile.open(sys.argv[1], 'r:gz') as archive:
    seen = set()
    for member in archive.getmembers():
        path = PurePosixPath(member.name)
        assert not path.is_absolute() and '..' not in path.parts
        assert member.isfile() or member.isdir()
        assert str(path) not in seen
        seen.add(str(path))
    assert 'kuma.db' in seen and 'db-config.json' in seen
ARCHIVE_CHECK
KUMA_RESCUE_DIR="$(mktemp -d /root/kuma-before-restore-XXXXXXXX)"
docker stop --time 30 "$KUMA_ID"
[[ "$(docker container inspect --format '{{.State.Running}}' "$KUMA_ID")" == false ]]
[[ -z "$(docker ps -q --filter "volume=$KUMA_VOLUME")" ]]
tar --numeric-owner --acls --xattrs --one-file-system \
  -czpf "$KUMA_RESCUE_DIR/newer-data.tar.gz" -C "$KUMA_DATA" .
(cd "$KUMA_RESCUE_DIR" && sha256sum newer-data.tar.gz > newer-data.sha256)
tar -tzf "$KUMA_RESCUE_DIR/newer-data.tar.gz" > "$KUMA_RESCUE_DIR/members.txt"
mkdir -m 0700 "$KUMA_RESCUE_DIR/quarantine"
find "$KUMA_DATA" -mindepth 1 -maxdepth 1 \
  -exec mv -t "$KUMA_RESCUE_DIR/quarantine" -- {} +
tar --same-owner --acls --xattrs \
  -xzpf "$KUMA_BACKUP_DIR/data.tar.gz" -C "$KUMA_DATA"
tar --compare --gzip --file "$KUMA_BACKUP_DIR/data.tar.gz" --directory "$KUMA_DATA"
docker start "$KUMA_ID"
KUMA_HEALTHY=false
for attempt in {1..60}; do
  if [[ "$(docker container inspect --format '{{.State.Running}} {{.State.Health.Status}}' "$KUMA_ID")" == "true healthy" ]]; then
    KUMA_HEALTHY=true
    break
  fi
  sleep 2
done
if [[ "$KUMA_HEALTHY" != true ]]; then
  docker container inspect --format '{{json .State}}' "$KUMA_ID"
  exit 1
fi
printf 'Newer state preserved in: %s\n' "$KUMA_RESCUE_DIR"
KUMA_RESTORE
The procedure first backs up the newer state and moves its current files into quarantine. It then extracts the earlier archive into the same volume and requires tar --compare to pass before starting Kuma. A failure after stopping does not force continuation or delete the preserved state: inspect Kuma’s status and resolve the error using the retained current copy.
The real restore used the verified decrypted copy of the encrypted backup stored on the other server. Before the service started, file contents, UID/GID values and permissions matched the earlier backup; the paused monitor created after that backup was absent. The same Kuma container became healthy, and the existing Coolify application remained intact.
| Post-restore check | Observed result |
|---|---|
| Fresh browser login | Password and TOTP opened the Dashboard. |
| Monitors | The two original monitors were Up; the paused test monitor created after the backup was absent. |
| Earlier outage history | The 20:57:36 UTC Down and 20:59:36 UTC Up events remained. |
| Notification | Test succeeded with the restored webhook configuration; the receiver recorded a new test event at 21:05:32 UTC. |
| Public status page | An anonymous browser opened both monitors and the completed notice under Past Incidents. |
This demonstrates restoration of the earlier application state as well as a successful service start. Loss of the server, migration to another VPS, and rollback after a version upgrade were outside this drill’s scope.
A disaster-recovery plan must also account for hostname routing, Coolify access and proxy configuration. Rehearse replacement-server recovery separately from the restore scope demonstrated here.
Maintenance and troubleshooting
| Symptom | What to check |
|---|---|
| The hostname does not load or the proxy returns an error. | Check A/AAAA records, the running Kuma service and the internal port selected for the domain. Do not bind a second service to the same host port. |
| The page loads but the live connection fails. | Check WebSocket forwarding and the browser’s network records. Publish on a subdomain rather than a subdirectory. |
| The site loads in your browser but its monitor fails. | The request comes from the Kuma server. Check that server’s DNS, IPv4/IPv6, TLS and access through the target firewall. |
| The monitor stays Up on an error page. | Inspect the response status code. An error served as 200 needs a more meaningful health endpoint or content check. |
| The state changes but no notification arrives. | Verify that the notification is assigned to that monitor, its test succeeds and the receiver records the actual event. |
| Redeployment opens the first-account form again. | Check the /app/data mount and actual volume name before creating another account. An empty or different volume may be attached. |
Read the release notes before changing the image tag, take a consistent backup and account for monitoring pauses during maintenance. Recheck sign-in, monitors, notifications and the status page afterward. Returning to an older image alone is not a recovery plan if the database schema has changed.
Track disk usage and choose a history-retention period that fits your needs. Uptime Kuma focuses on service availability; the Grafana guide covers a different layer for detailed infrastructure and application metrics.
Frequently asked questions
Is Uptime Kuma free?
Uptime Kuma is open source. When you host it yourself, you still pay for the server, storage and any notification provider you choose.
Can I install it without Coolify?
Yes. The project also supports direct Docker installation. This article uses an existing Coolify proxy and service management; a bare-metal or separate Nginx installation is outside this procedure.
Is running it on the same VPS as my application enough?
It can help detect a failing application response. Independent detection of that VPS or its network becoming unreachable requires a separate monitoring server.
Can one monitor cover everything?
Each monitor tests only the target and conditions you configure. Create separate checks for the web interface, API or dependencies as needed, while avoiding duplicate alarms that add no useful information.
Leave a Reply